Once you have calculated volume attributes, you can scan your 3D block using a timeslice. It provides a good first looks of what’s inside your block. however, as it’s a timeslice, it means you are looking features on the same plane that are not of the same stratigraphic age (particularly on dipping structures). Surface attributes are designed to extract any attribute and to project its values on a surface (or an horizon).
Pre-requisite: you need first to learn how to pick horizon and create surfaces:
In the following example, we will try to evidence vertical seep structures (i.e. fluid pipes) feeding small seafloor depressions (pockmarks).

The first step is to propagate a horizon crosscutting fluid pipes. I picked a trough event that is quite continuous in the area. The horizon can then be displayed in a 3D window as show below:

Keep in mind that horizons are made to create surfaces. Most of the work done on seismic is based on surfaces (not on horizons !). Once done, you should rename your horizon: right click on its name in the left pane and click « settings ». In the menu « info » you can change the name.
So, at this stage you must create a polygon around your area of interest. I strongly suggest you use a 2D window. Display your horizon and start clicking using the polygon tool. Think that you must double click one point before the end to close your polygon.
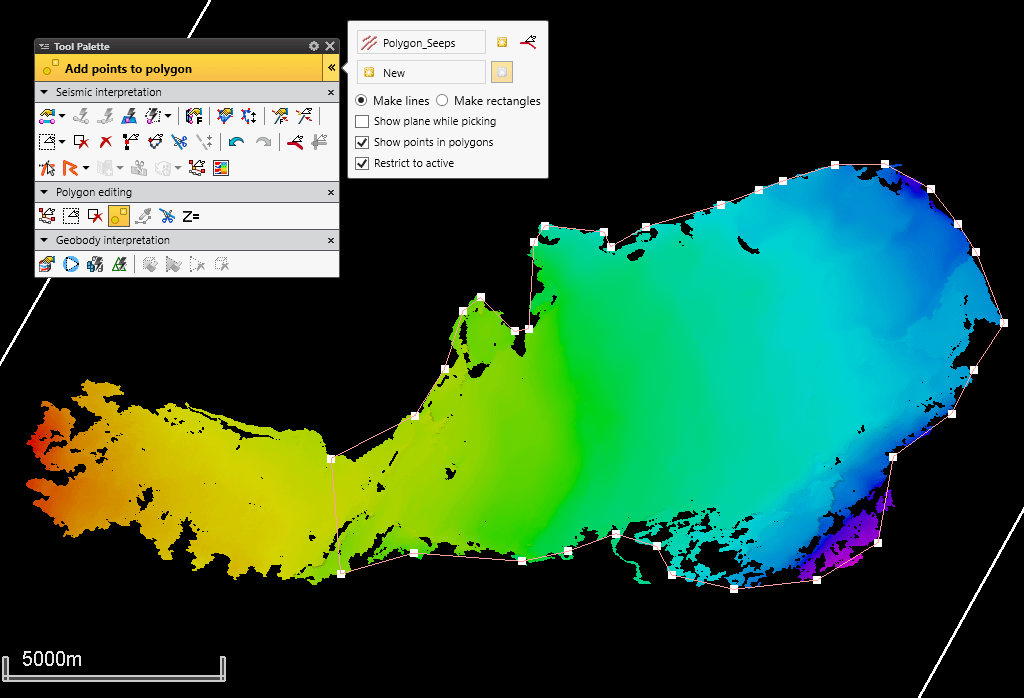
Then you can create a surface: on the top menus, click on « make surface ». In the window that opens, insert your horizon using the blue arrow next to « main input ». In « boundary », insert your polygon. In the menu geometry, select « automatic » and in grid increment enter appropriate values. By default they are set to 50 but, depending on the zooming level, you can increase your grid. Here I’ve used 20×20 cells. Even if the default Algorithm is not bad, in some cases you can try another one. I generally use « minimum curvature ». Click ok. Your surface is added at the end of the list in the left pane.

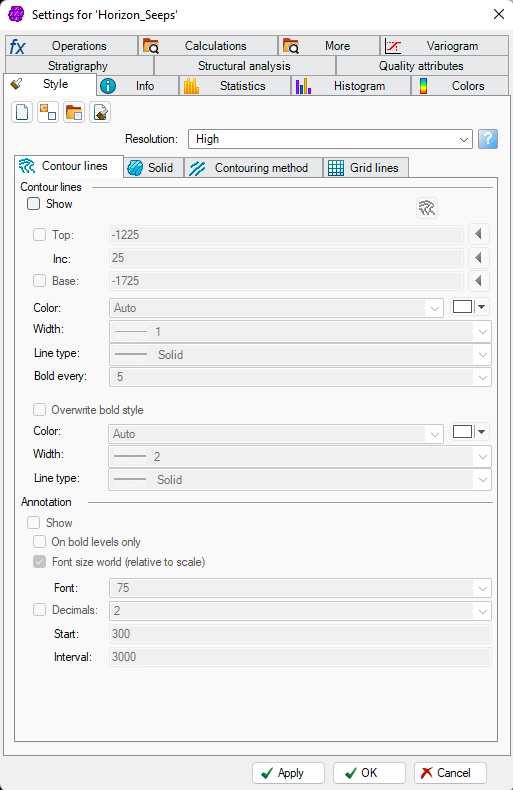
Right click on it and click settings to open the style menu. Untick the contour lines « show » to remove the lines on your surface.
Now, your surface should look like this in 3D:

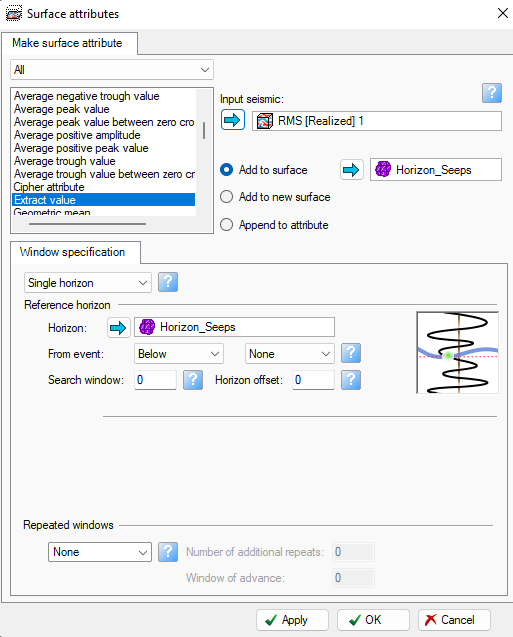
You are ready. In the top menu « seismic interpretation », click on « surface attributes ». In the window that opens, select « extract value ». Select the seismic block in the left pane and click on the blue arrow to send it in the input seismic. Click add to surface and select the surface in the left pane and click on the blue arrow to send it there. Do the same for the reference horizon below.
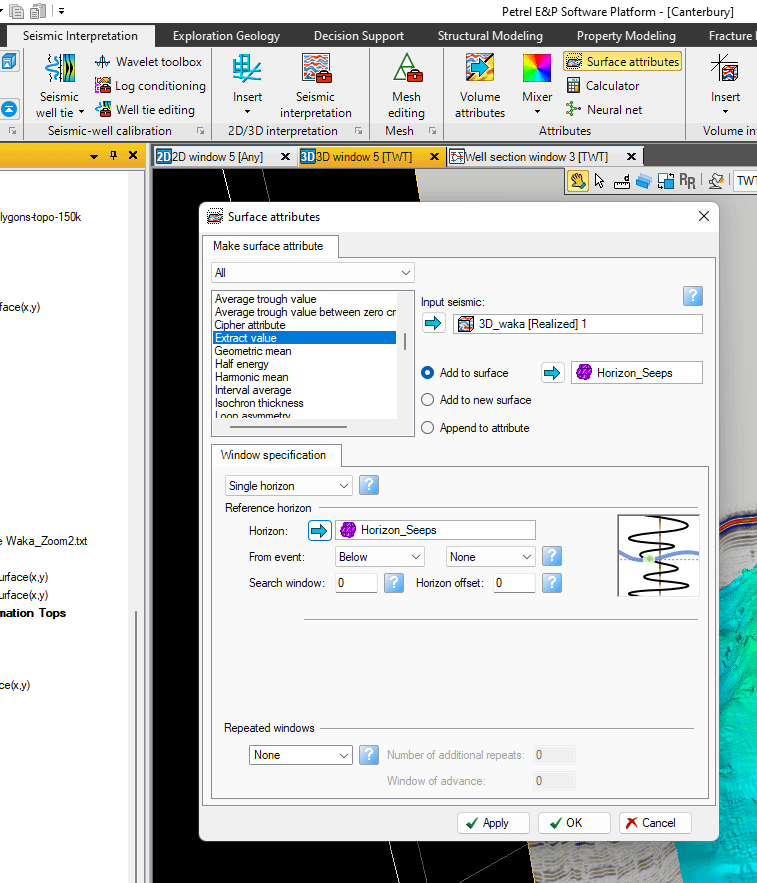
Once you click on Apply, the newly created surface is added below the surface in time (TWT) in the left pane.
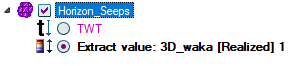
It means that we have extracted the amplitude from the original seismic block and all values have been projected on the surface. It can be displayed in 3D.
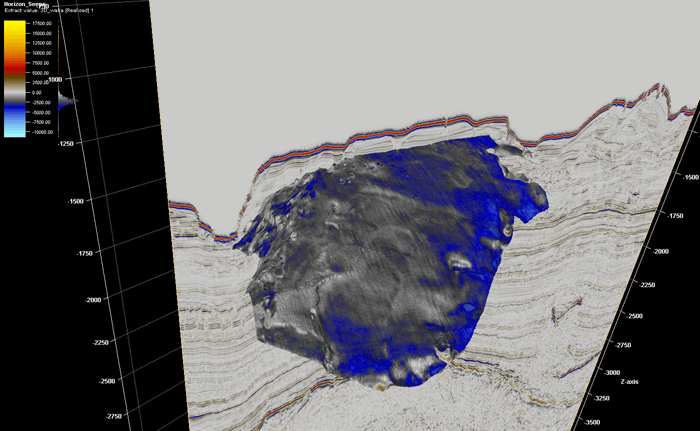
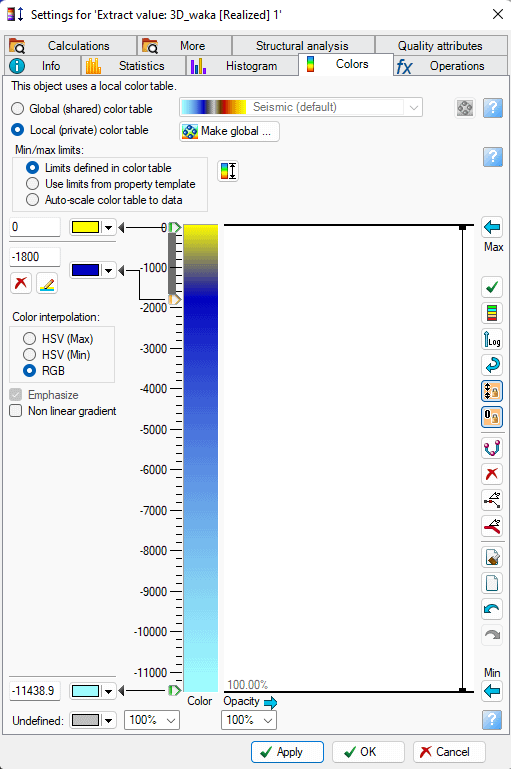
The main problem here is that the initial horizon was a negative event (trough), so all values are negative, but the colorbar is set to negative AND positive values (which artificially extends the displayed values). Right click on the newly created surface and click on settings. In the window that opens, click on the color menu. In Min/Max limits, click on « limits defined in color table ». Set the maximum value to zero ! and click apply.
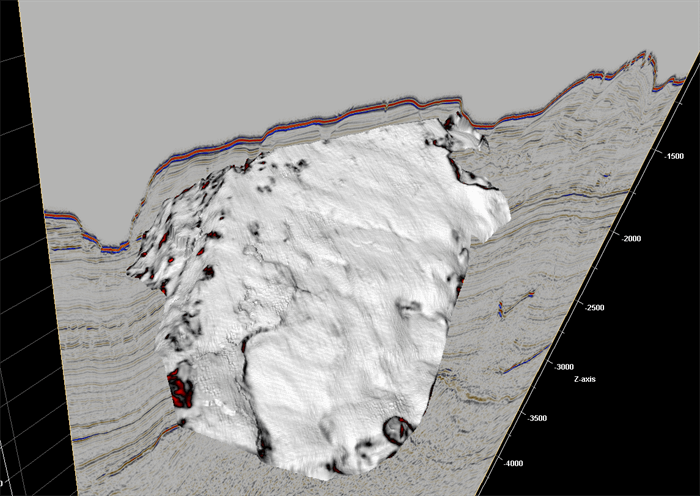
So, now your surface should look like this:
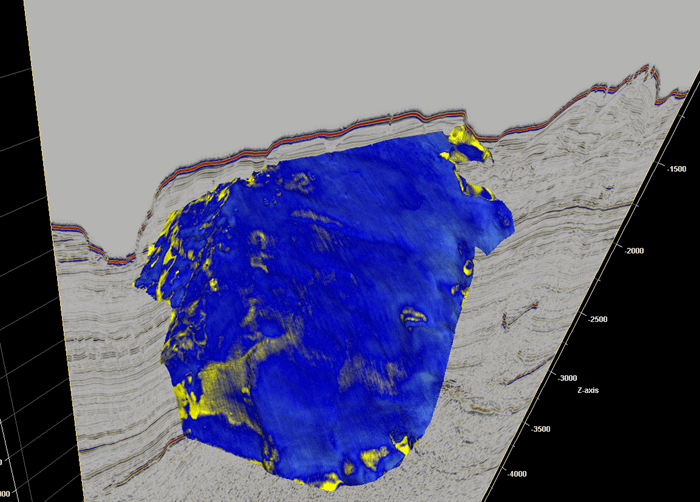
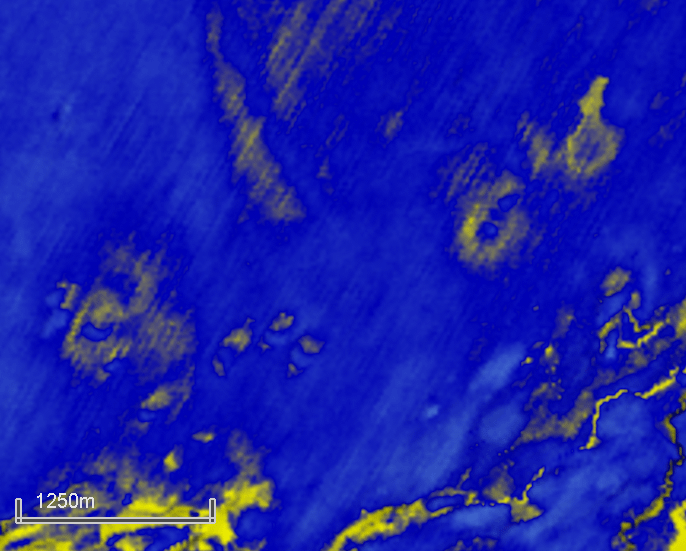
You can see here that pipes are enhanced. They appear as rings of high amplitudes, compared to surrounding average negative amplitudes. See the zoom in image below:
Let’s go for further interpretations !
as you have previously created volume attributes such as RMS, Variance, Chaos, you can do the same modifying the main input:
Once done, you must check the range values of your RMS block by viewing values in settings -> colors. Here it’s from 0 to 13620. So, right-click on the newly created surface, click settings and in the color menu, change the values as previously described.

Your RMS surface should look like this:

The dark blue spots represent pipes. In details we can also evidence some other features such as rings. As RMS is designed for the fluid content, it means that only pipes containing fluids (gas) are evidenced on this surface. So, we need other attributes such as Chaos:
You must apply the same procedure as previously described. Chaos can highlight anomalous features compared to well stratified sediments with average amplitudes. In details, other pipe structures are identified along the slope break of the canyon:

At this stage you can try other volume attributes depending on your needs.
ENJOY !