You find an interesting map, for instance in an article and you want to import it in your QGIS project.
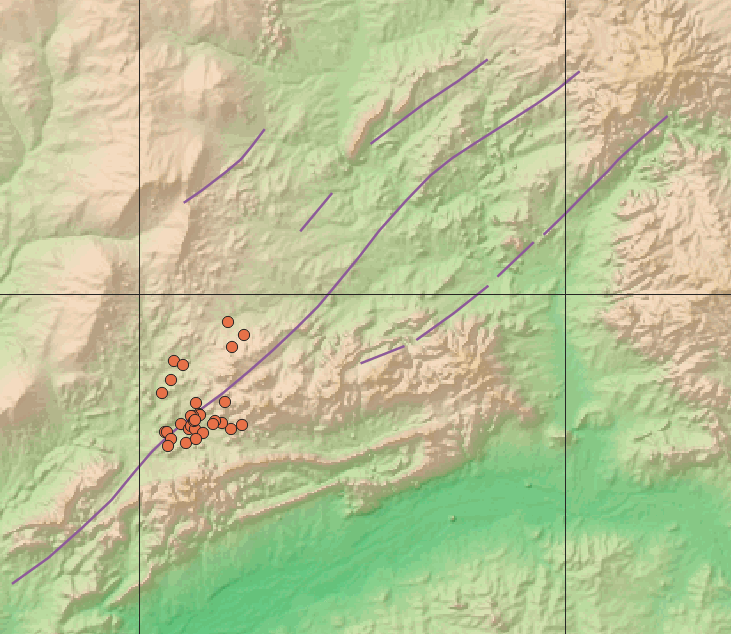
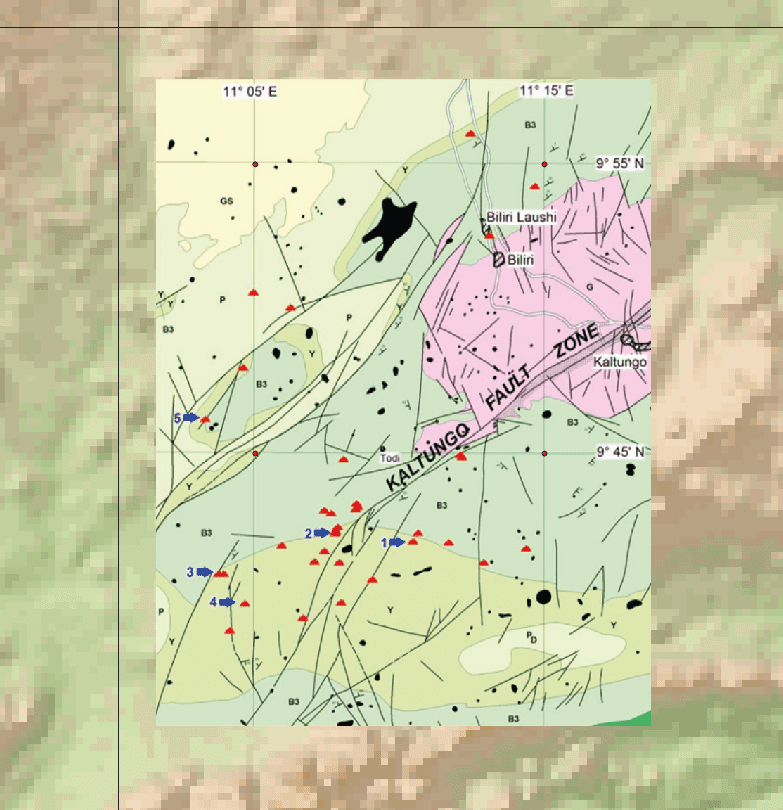
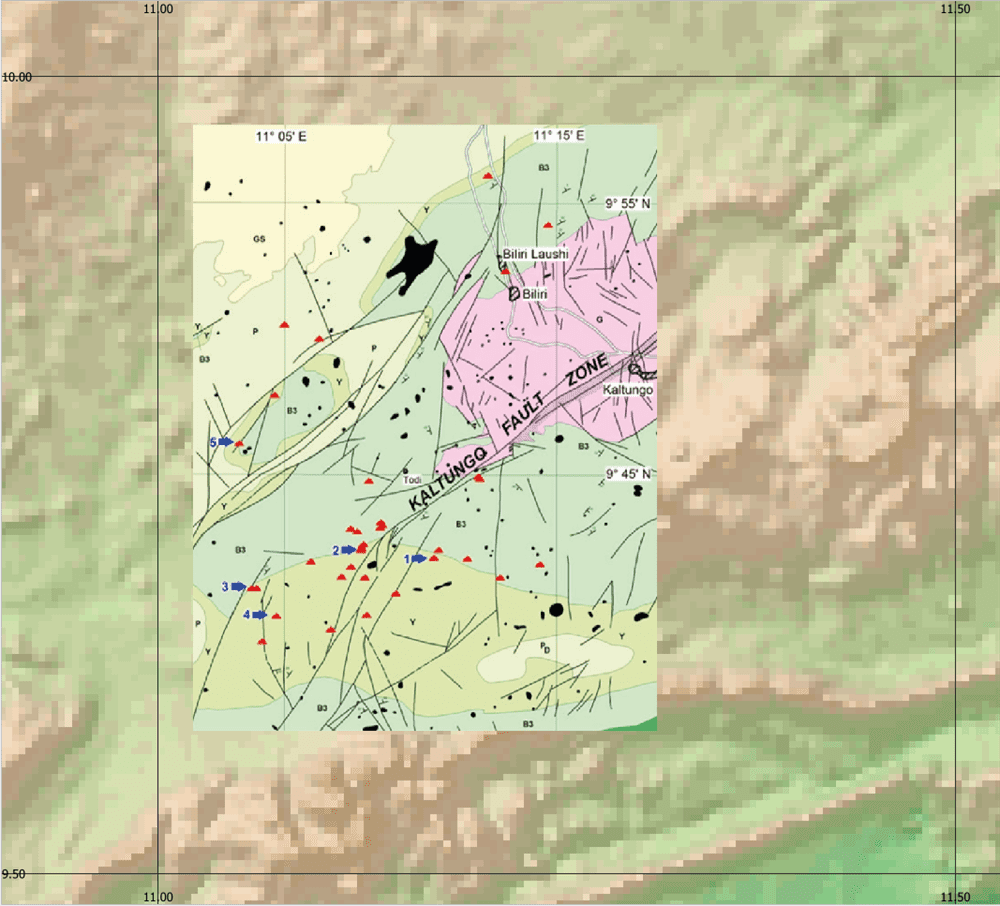
The main aim will be to redraw some features (points, lines) that you need in your study (creating a structural map for instance). You will obtain this kind of map:
First, you need to extract the map as an image:
Open your pdf file
Under window, press simultaneously on home+shift+S
The cursor will transform into a cross and you click on the upper left corner of the image and drag it to the lower right.
Click on the image that pops up (or paste it in a paint like software and save it)
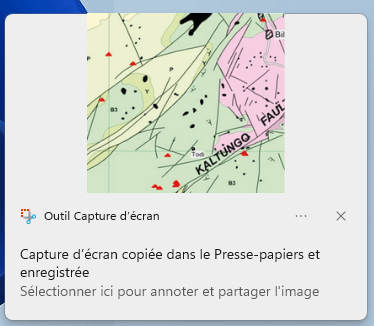
Save your image either as a jpg or png file (be sure it is located in the right folder = the folder containing all your qgis files/maps)
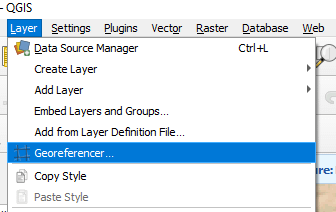
In qgis, click on the layer menu and georeference
In the window that opens, click on open raster
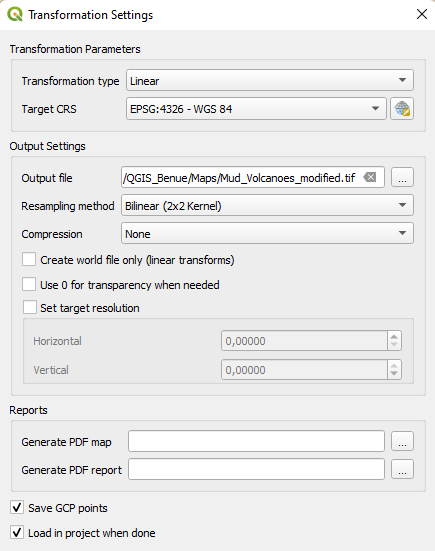
Then click on the yellow wheel and define parameters as follows:
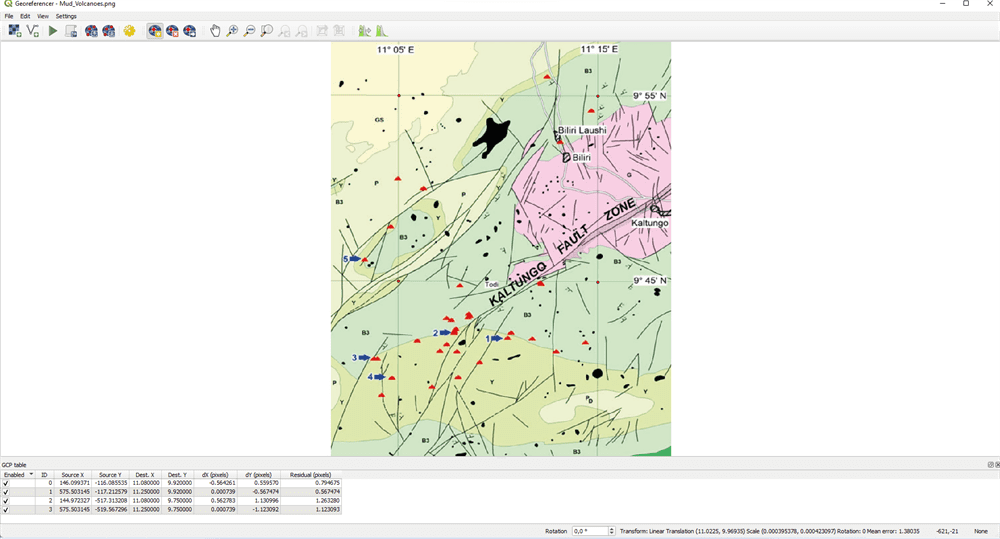
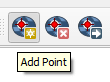
Your are ready to georeference the map. Click on add points:
and start clicking on the first reticule on the map:

Add coordinates in the window that pops up. In this example, coordinates are in degrees/minutes. You need to transform in decimal degrees. It means that 11°5′ = 11,08. A simple way is to do minutes/60*100 = decimals. Here it is 5/60*100=0.08 so the result is 11.08
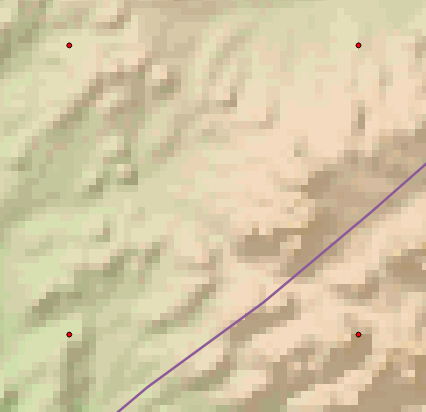
Once the point is added, a red circle appears both on the georeference window and in the qgis window:
You repeat the operation for all known points with coordinates and then, in the georeference window you click on the green triangle:
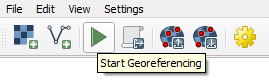
The georeferencing process has started. Depending on the number of points it can takes time. Here with a few points, it takes a few seconds, and your map is added in qgis:
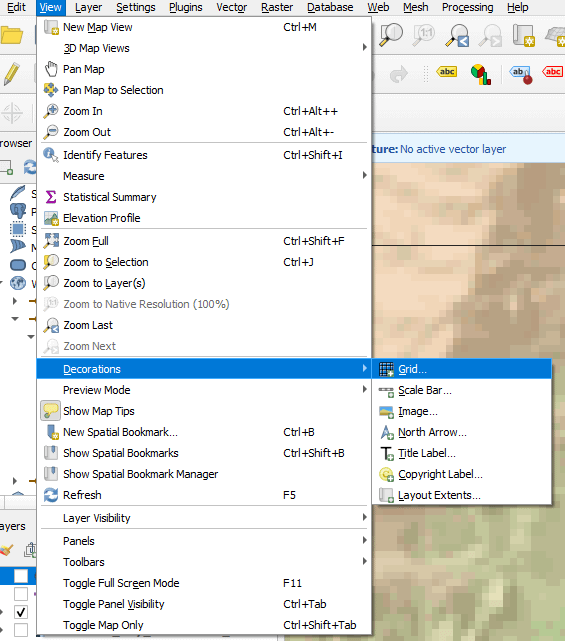
If you want to add a grid of coordinates, click on View menu -> Decorations -> Grid
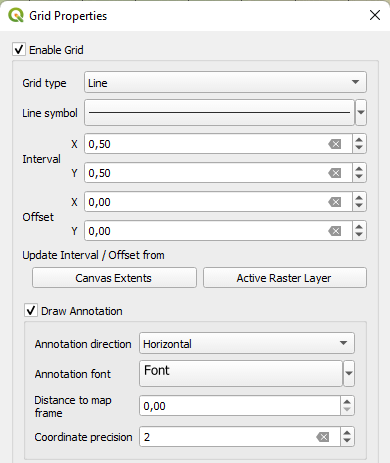
In the window that opens, just select what you want, for instance a line every 1° or every 30′, depending on your own preferences.
The map should appear like this:
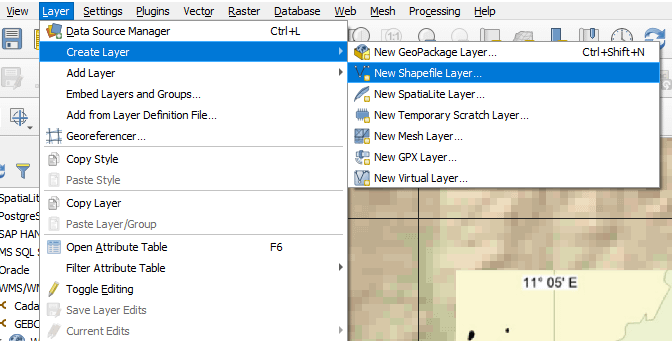
Then, you can add layers to redraw the location of red triangles. In the top menu, click on Layer -> Create Layer -> New Shapefile Layer
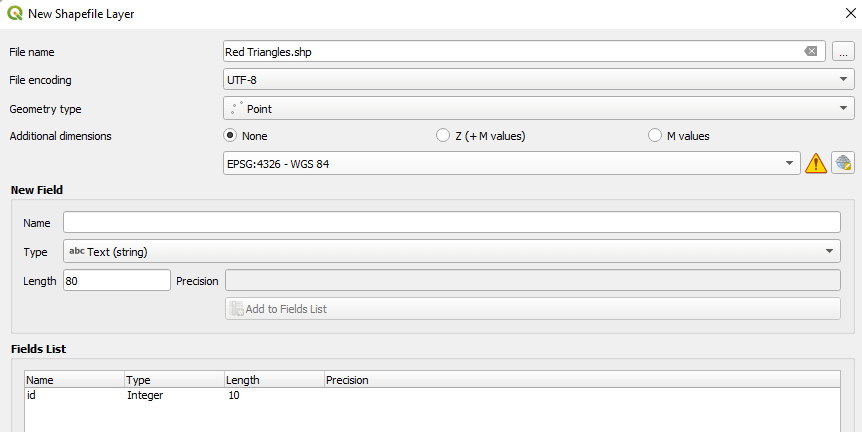
Choose a name and select the kind of feature you want (i.e. points, lines etc…) and click ok
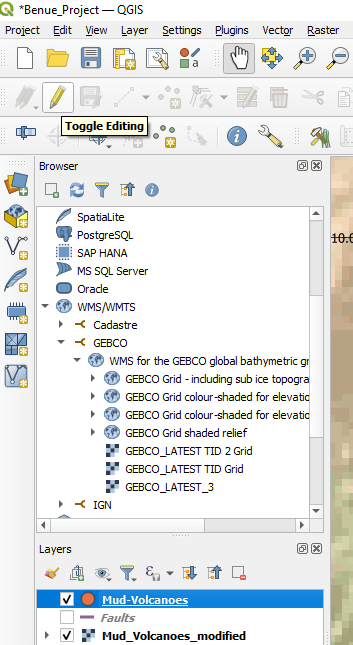
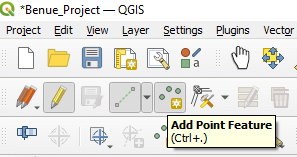
Once done, your shapefile appears in the left pane. Here red triangles are mud-volcanoes, so I choose the name as « mud-Volcanoes ». Select it and a yellow pencil appears below the menu. Click on it to enable editing.
Then click on « Add Point Feature
Each time you click on the map, a window opens:
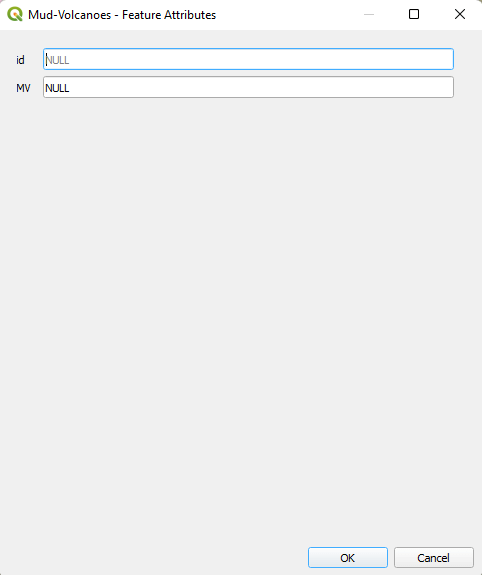
You can give a number here or whatever you want (attributes, nature of samples etc…) or just click on ok.
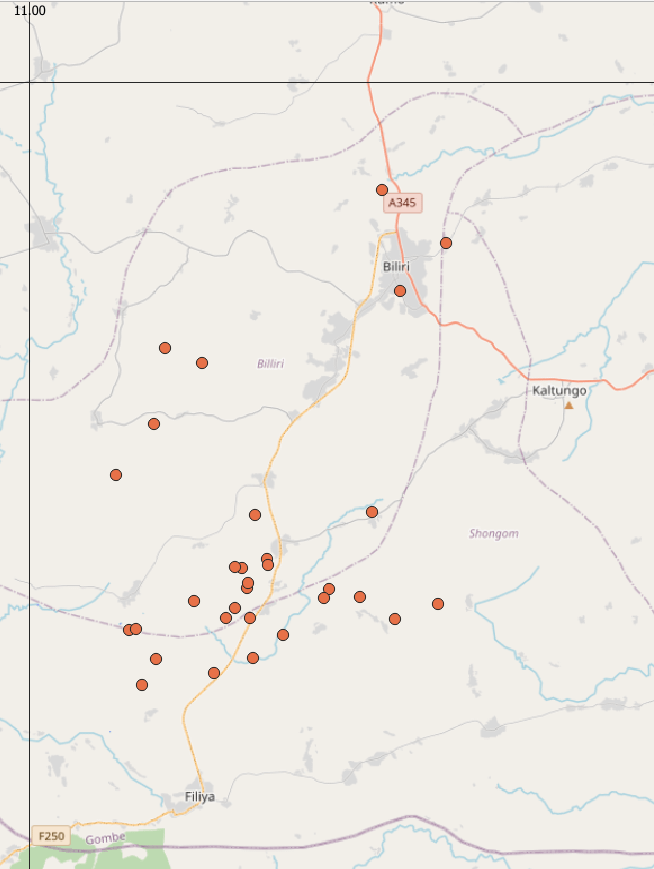
You click as long as you want to add points. Once done, don’t forget to click the save button next to the yellow pencil.
Now you can untick the map and select another map below your points, such as openstreetmap or gebco map.
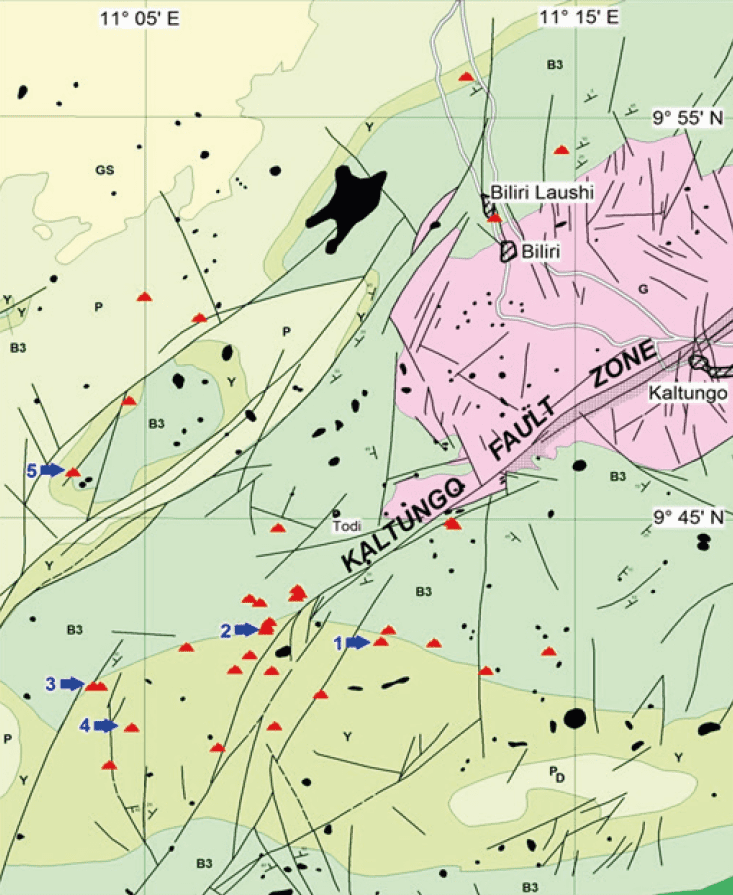
Now, we will do the same with a structural map. However, we don’t have coordinate reticules. On the map, cities are reported as black circles.
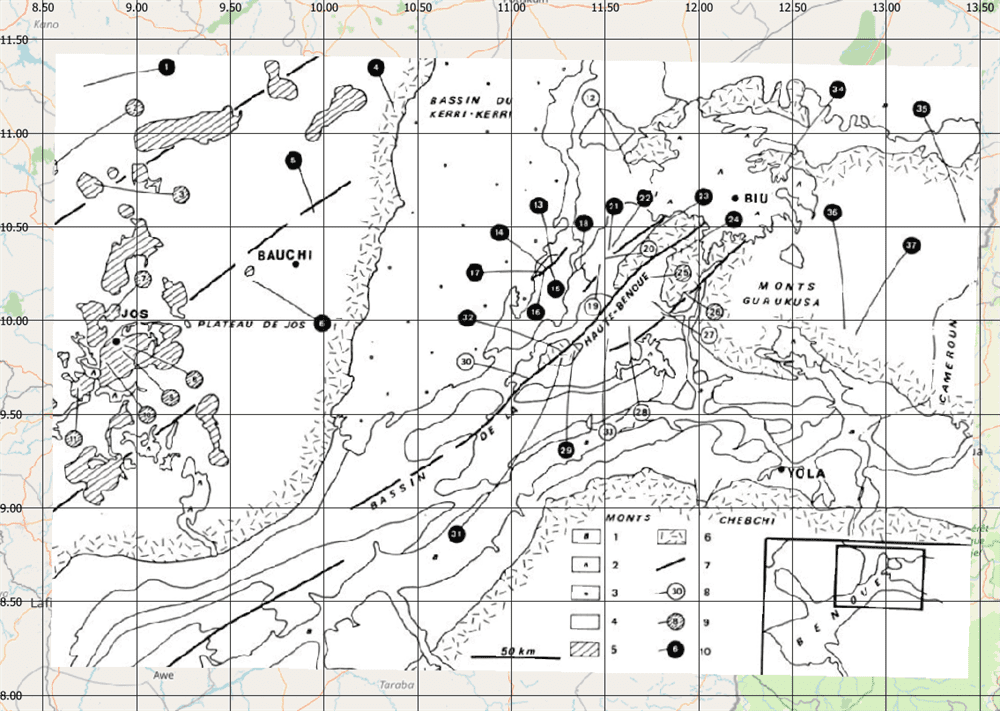
So, instead of adding coordinates in the georeference window, click on the city (or any point you can recognize in the gqis window), and then click on « from map canvas ». Click on the map on the same point. Both points are associated now. Repeat the operation for all recognizable points. Follow the same procedure as describe before. The map is georeferenced and should look like the image above.
Now we will digitize faults. This is the same procedure as shapefile with points but select lines instead.
Click on « Add line features » and start digitizing the faults. At the end of a segment, right click and click ok. The line is added. Don’t forget to save at the end by clicking on the save button next to the yellow pencil.
Now you can untick the yellow pencil and select the map you want to display with both the points (Mud-volcanoes in this example) and the faults:
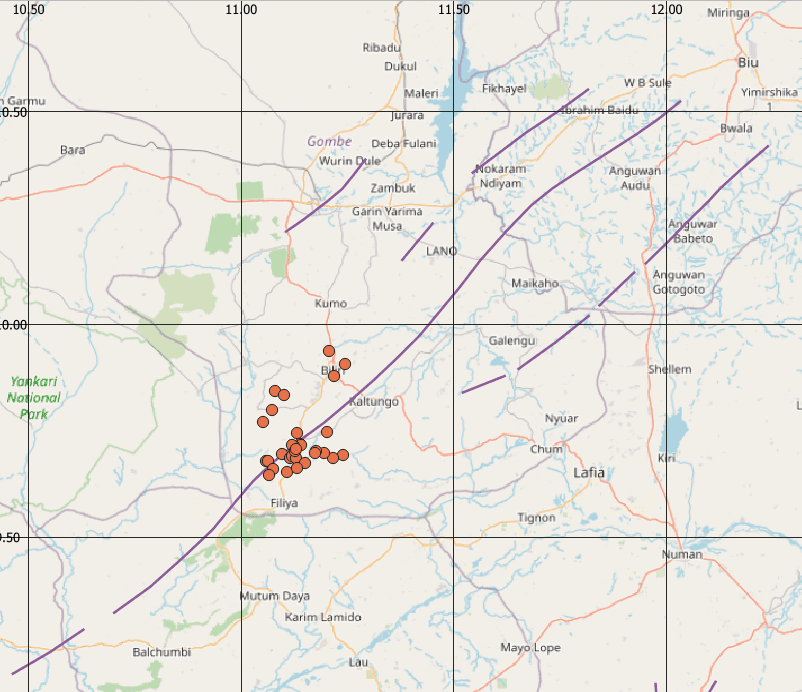
ENJOY !