Do you know that your seismic data can be displayed as geological outcrops ? Try a pseudo-relief attribute. It can be calculated in kingdom and then exported to Petrel. Follow the guide !
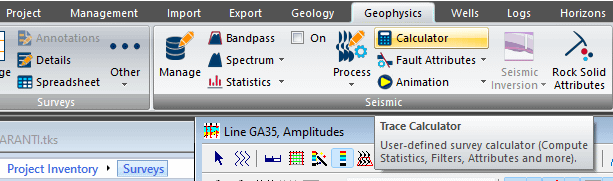
In the top ribbon, click on the Geophysics menu -> Calculator
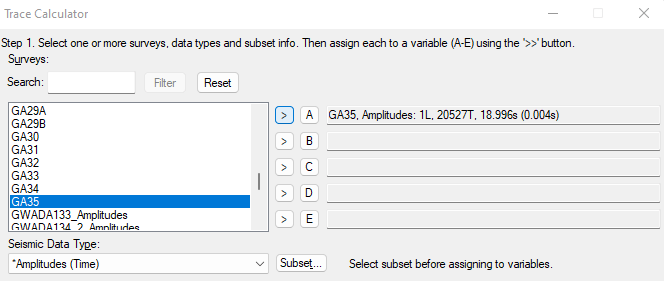
Step 1: In the window that opens, you must select the seismic line you want to be displayed as pseudo-relief, click on the small arrow close to the « A » Button. It is now considered as A variable.
Step 2: double click on pseudo-relief in the list and then type A or click the A button, add a comma and a number (M variable as described in the function description). It is supposed to be between 1 and 5). You can try several options here.
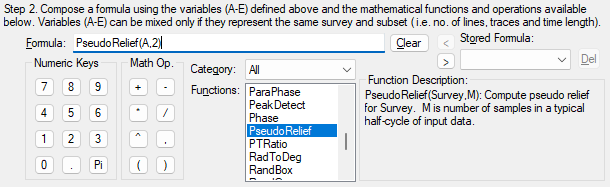
Step 3: select the survey (i.e. the profile you have selected in A). If pseudo-relief doesn’t exist in the list of seismic data type, click new type and write « pseudo-relief ».
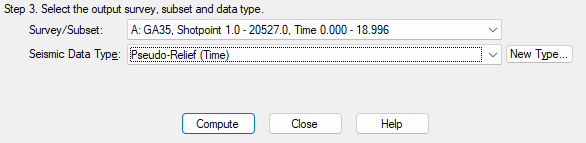
Once everything’s of, click « compute ». A new window opens asking where to store the newly created profile. I suggest you choose the same folder as your kingdom project.
Once done, you can close the window.
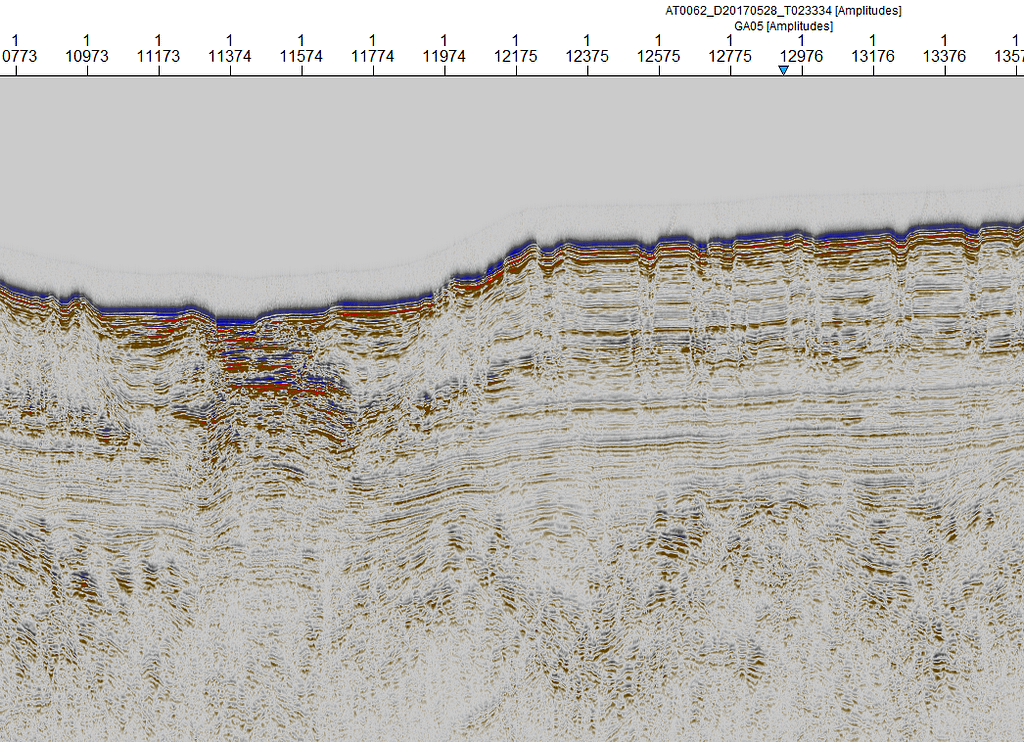
Open the seismic profile
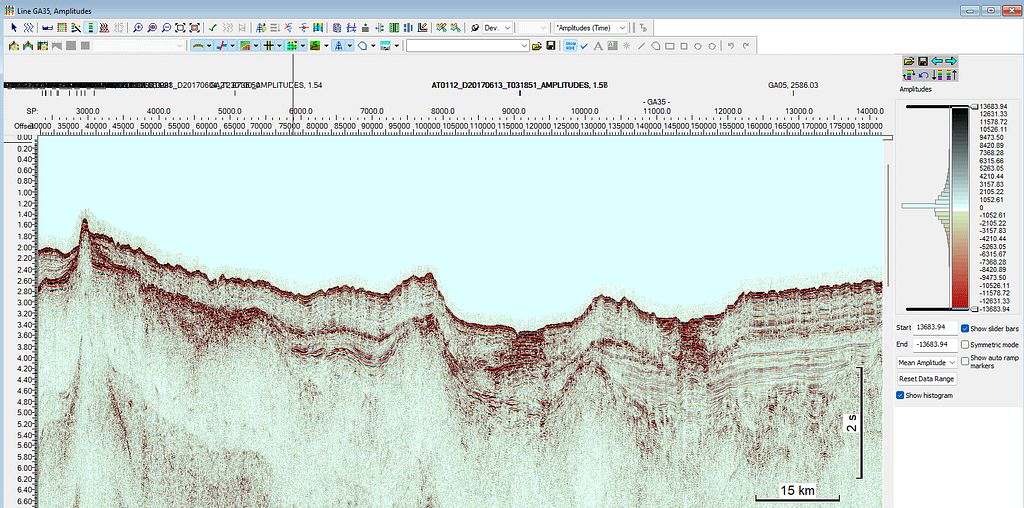
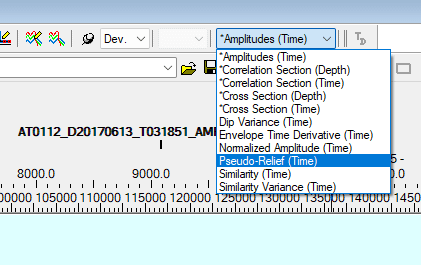
in the top right menu, you can see « amplitudes (time ». You can click on it and select « Pseudo-Relief (Time) »
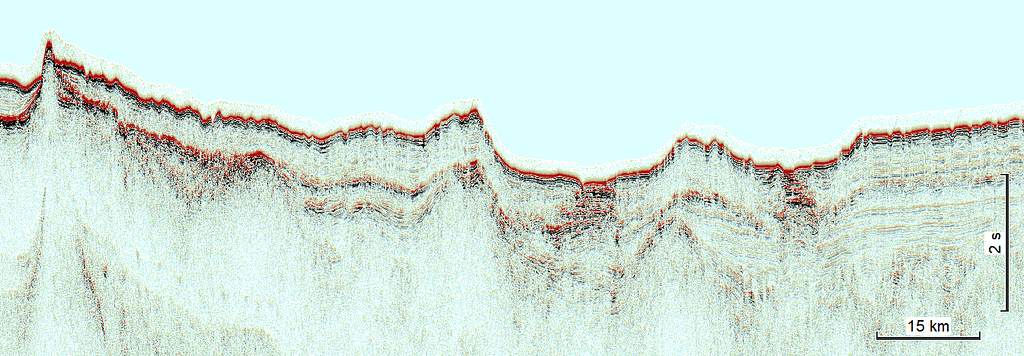
Now, your profile should look like this:
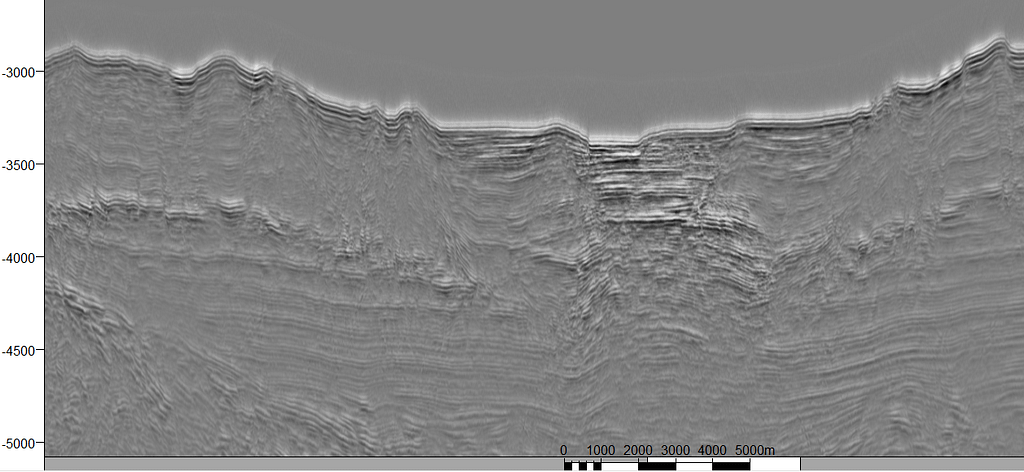
Select a black and White colorbar
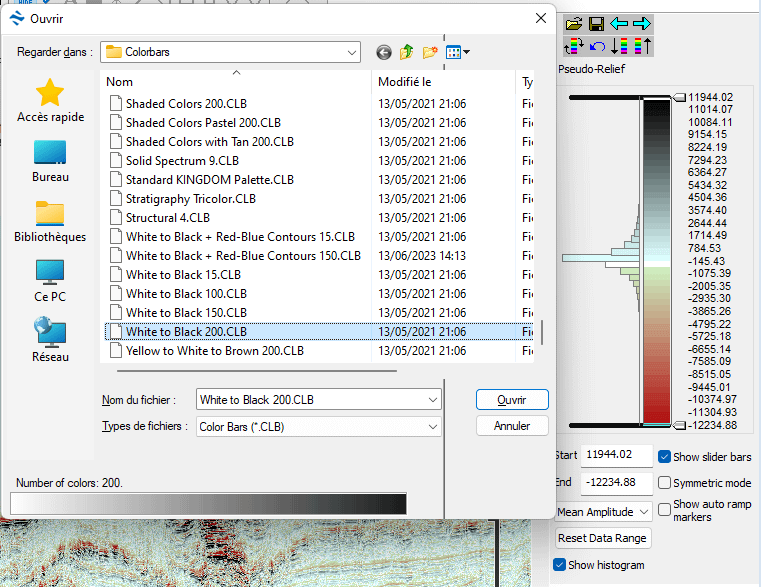
Now the profile should look like this:
Now, flip the colorbar so the positive amplitudes are in black:
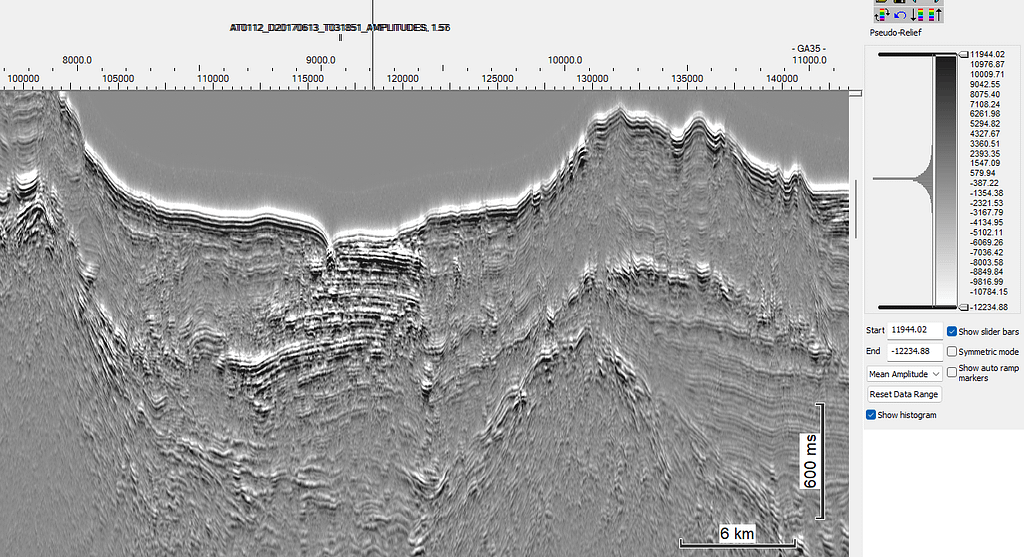
You can type F5 or F6 to apply gain:
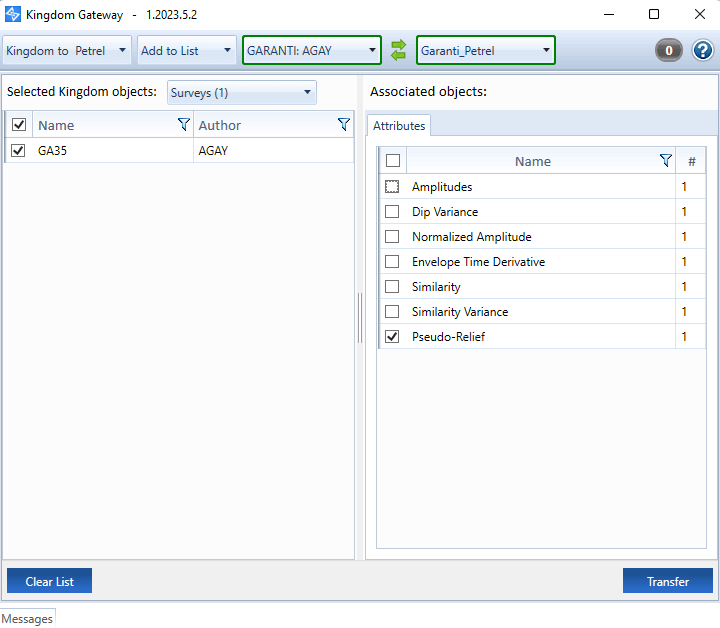
So, now if you want this profile in Petrel, you can use the Gateway:
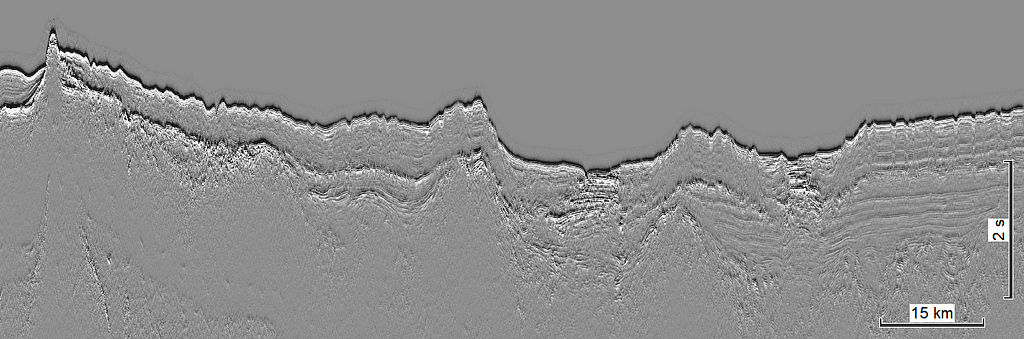
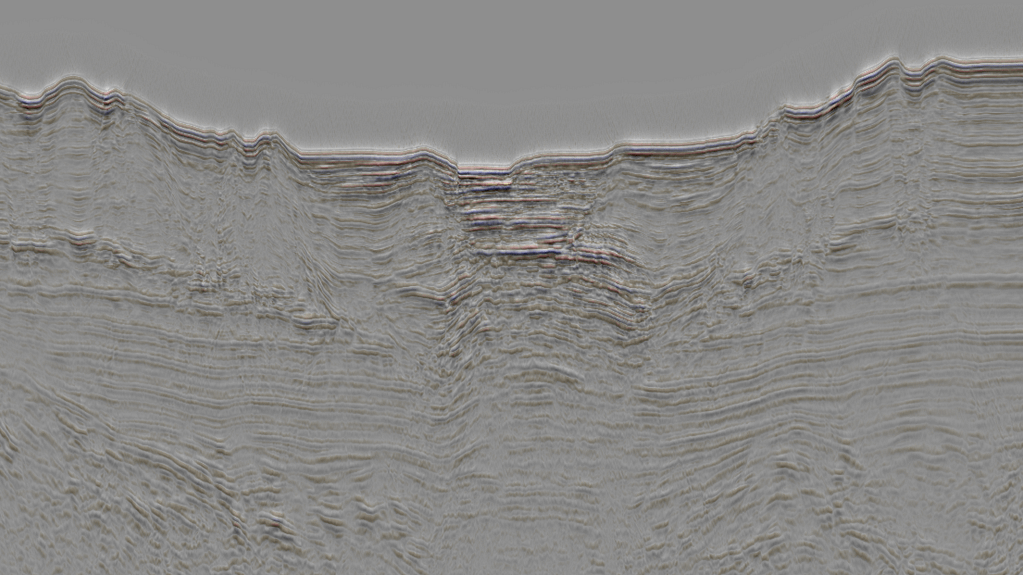
Just wait and once it’s done, the profile should look like this in Petrel:
So, right click on the profile name and click settings. In the menu that opens, click on colors and select a black and white colorbar, then click on Local.
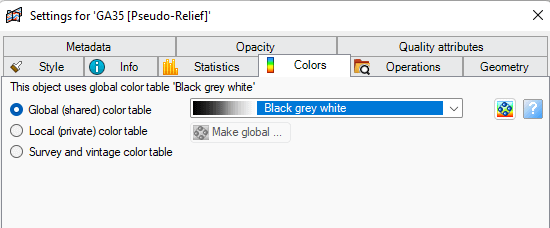
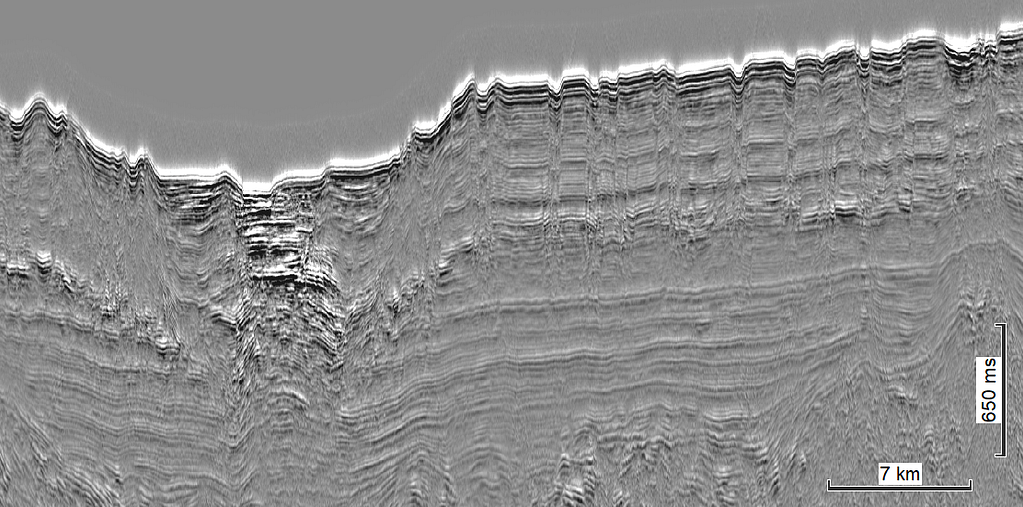
Then, click on autoscale and eventually reverse the colorbar.
It’s done !
Now, you can play with transparency in a 3D window. Open a 3D window and display the profile in amplitude AND in pseudo-relief. Set transparency of the pseudo-relief profile to about 80%
Enjoy !