Loading well data can be a nightmare.
The very important thing is to check whether the window is displayed in time (TWT). Have a look at the top of the window and select either TWT or TVD (in meters) or Any (both time and depths. In the case of TVD and Any, Petrel will display meters measured in the well in time, so it’s wrong !

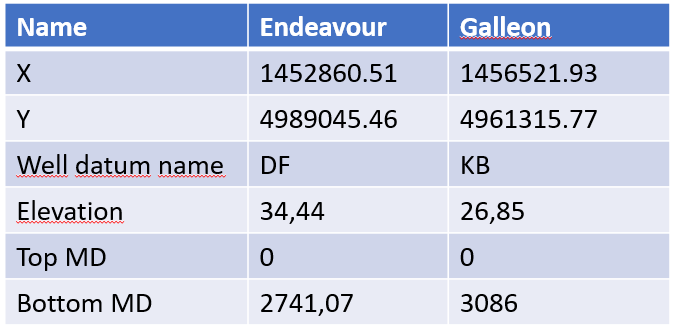
Please, keep in mind you need:
> Location in XY or Lat/Long
> Checkshot data (this is the time-depth law)
> Deviation path (only if you well is deviated, otherwise it will be considered vertical)
> Data to display (i.e. Gamma-Ray, Density, Sonic etc…) in LAS format or ascii
> Top of data (i.e. Kelly Bushing, Sealevel etc…)
> Bottom of well (the deepest point reached by drilling)
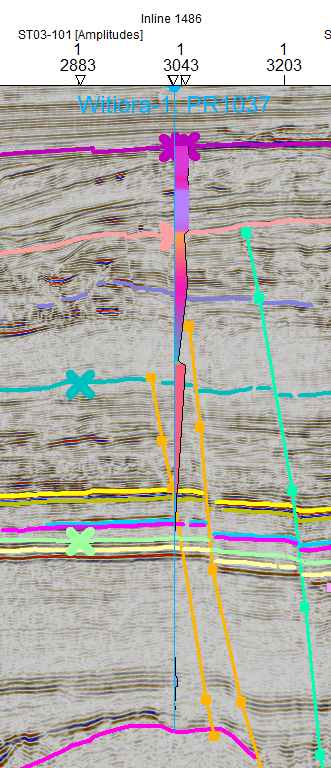
Here is an example in New-Zealand:
First, you can create a new well by clicking on top of the Petrel window on « well engineering or design » and « add well » or « new well ».
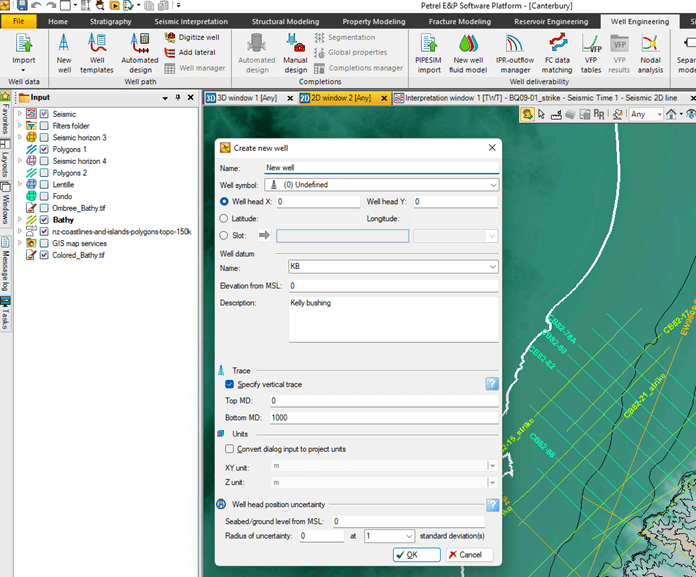
Fill out necesssary informations (see the table provided above) and click ok
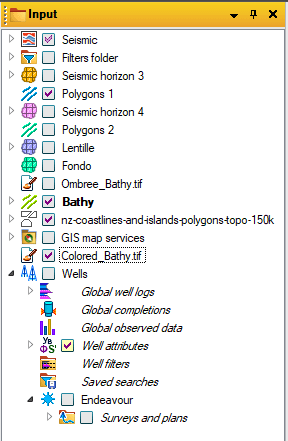
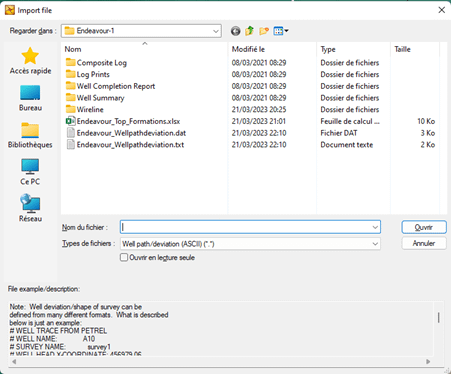
A new well is created. Here it’s called Endeavour. At this stage, the well is empty and can only be displayed in map view. Right click on « survey and plans » and click on « import (on selection).
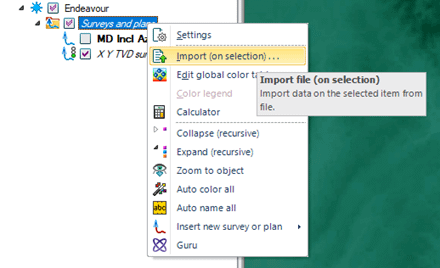
The extension is « well path deviation » and select the appropriate file containing informations. Please remember that this step is requested only if the well is deviated.
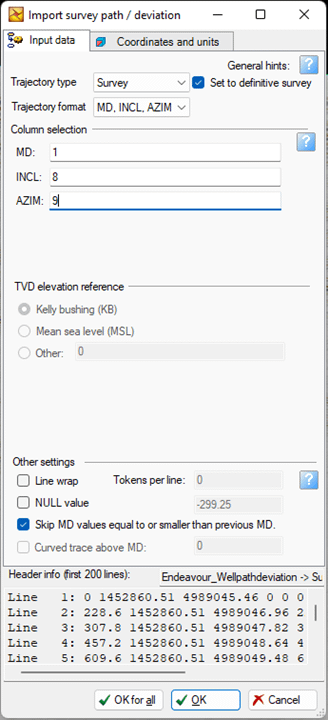
Depending on the ascii format, open the file to check the column number containing MD INCL and AZIM data. Then click ok
In the left pane, be sure that a sub menu is present. Right click on « X Y TVD » and click on « trajectory spreadsheet ».
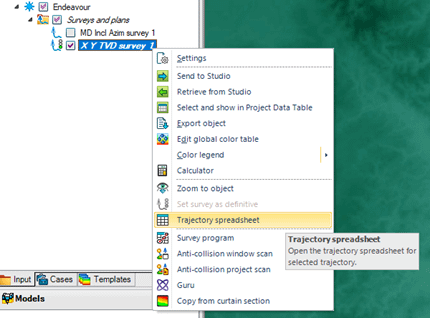
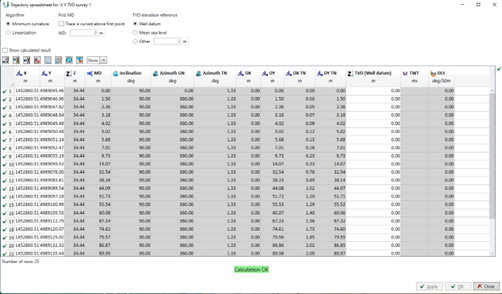
You can check whether the data have been properly loaded or not. If not, you must review the column numbers.
Once done, you right click on the well name in the left pane and click again on « import (on selection). Select the checkshot format extension and click on the ascii file containing the TD chart.
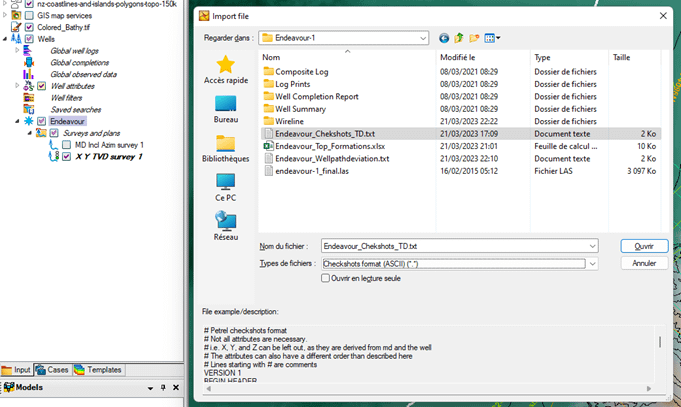
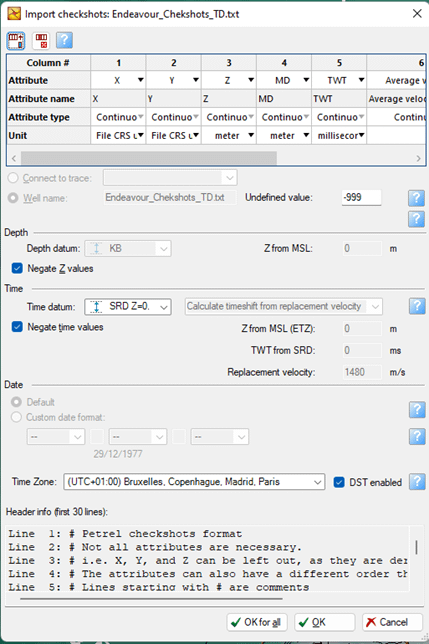
The window that pops up contains all requested informations:
Attribute = the nature of the column, Attribute type, Unit (take care here !!!!, depending on your data, you must set in meters or feet and in seconds or milliseconds).
In petrel, the seismic is positive downward. However, your data may be negative downward as in Kingdom. So, tick the box « negate Z values: it means that the negative depths in you file will be converted to positive (not very intuitive !). Can be the same for time. So, just check. Then click ok.
Now, you must apply the Time-Depth conversion (it’s not automatic). Right click on the well name in the left pane and click on settings. In the « time » tab, create new TD Chart: provide a new name. As your well has its own TD chart, slect « override global settings » and « from velocity function » and tick the box corresponding to the TD-Chart file. Then click « RUN ».
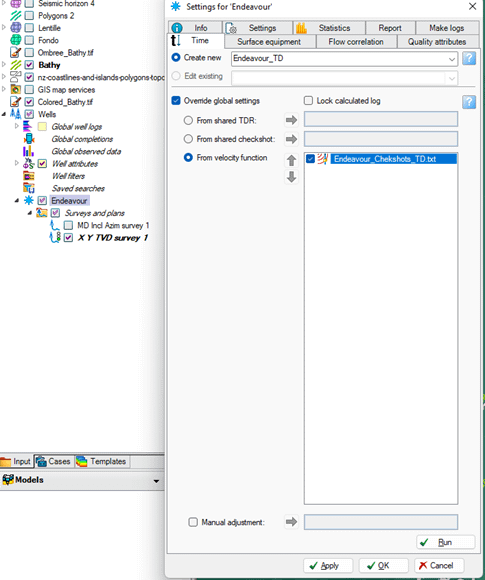
That’s it !!!
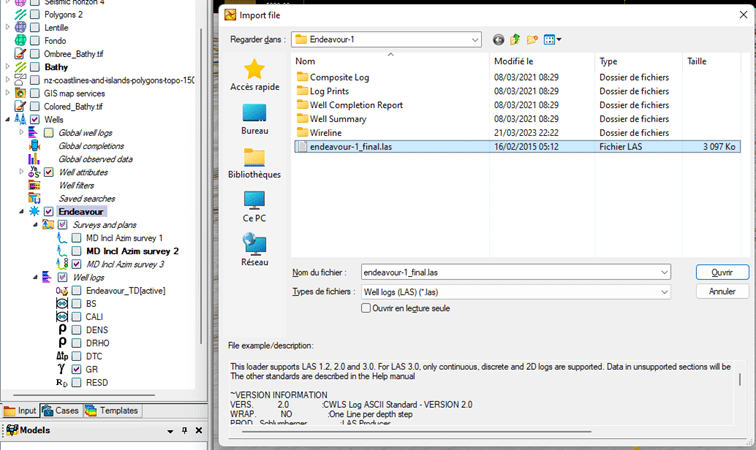
LOADING WELL DATA (LAS files):
You need now to import data. In the left pane, right click on the well name and select « import (on selection ». Depending on your data, select the right extension. Here it’s with LAS files.
A new window pops up. By default it’s set to « create new logs ». Click ok.
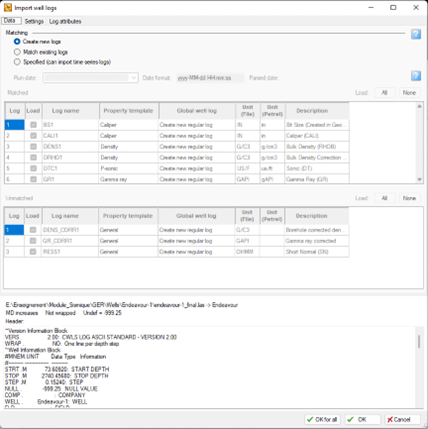
It’s done !
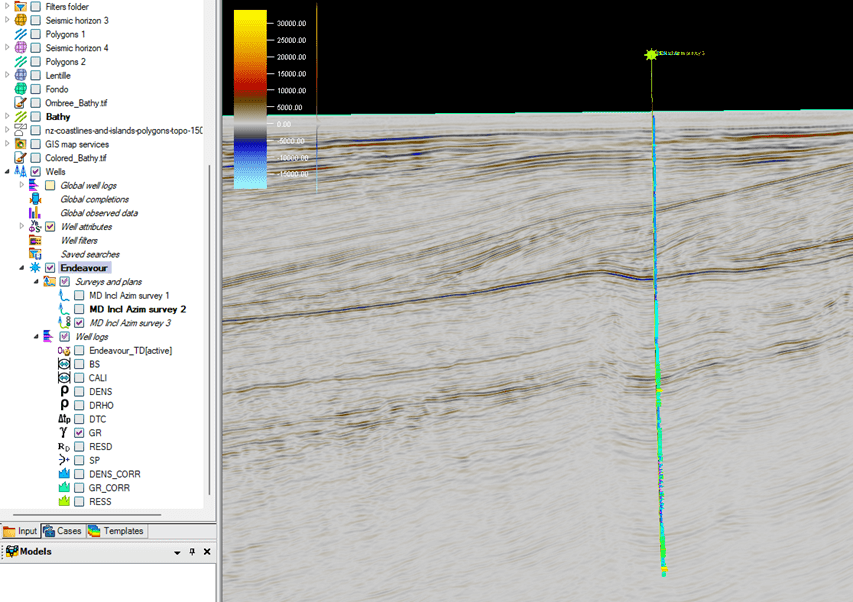
The data have been imported and are visible in the sub folder. Open a 3D window, tick the appropriate box. Here it’s GR for example.
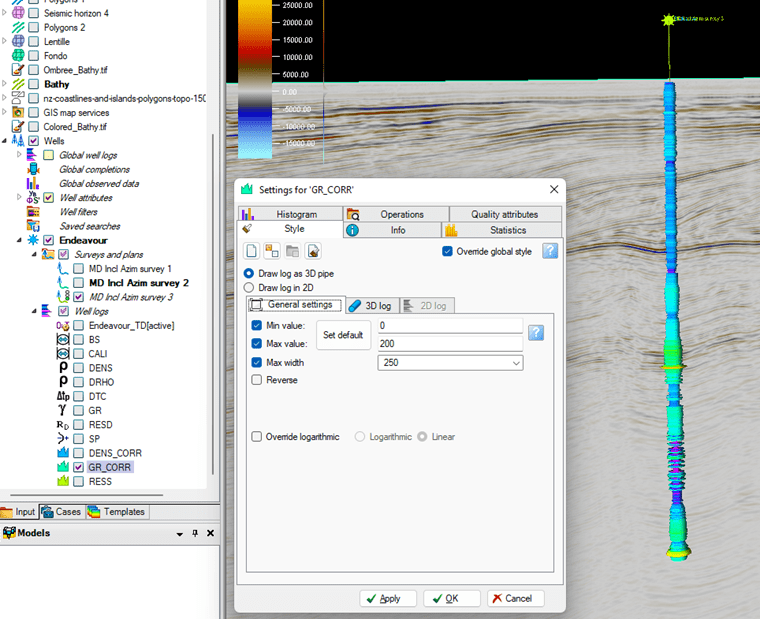
Right click on the attribute you want to change and click settings. In the window that pops up you can change the way the data are displayed.
WARNING AGAIN:
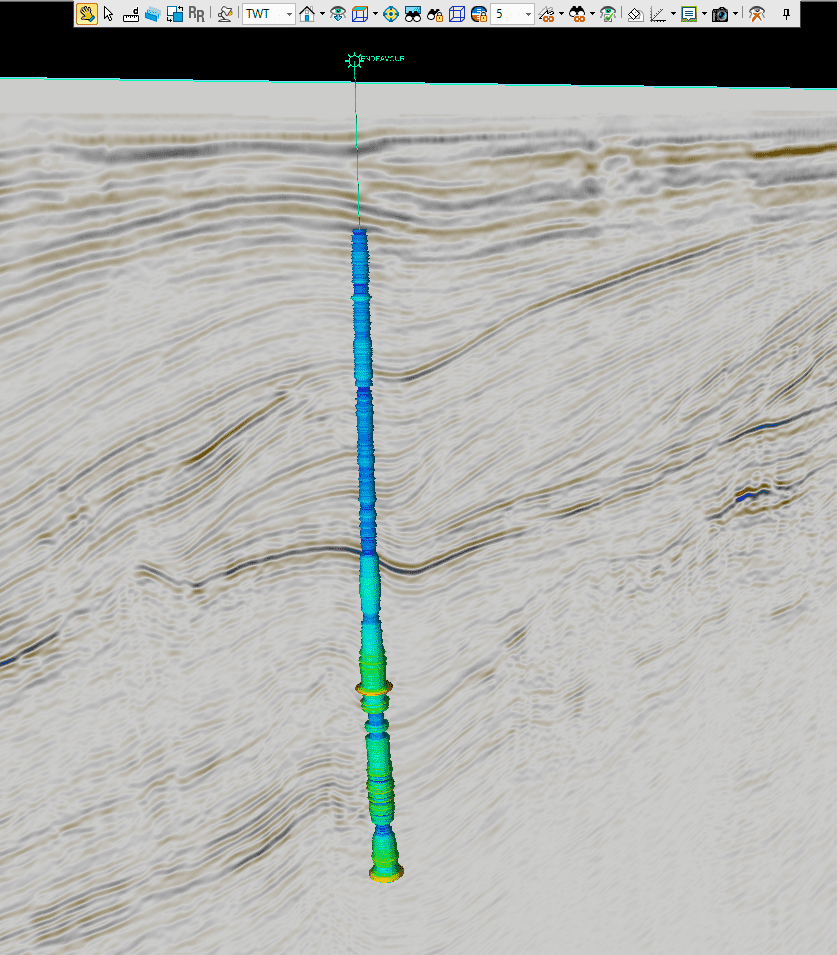
Sometimes, it seems that the well is not set at the right position, as if the TD conversion didn’t work. Just check the doamin in the interpretation window or in the 3D window: Set it to « TWT » as seismic is in time ! So, if set to TVD, it means that time will be displayed in a depth domain and…. it doesn’t work !
ENJOY !!!
LOADING CORES (ascii files):
First of all you must have a file containing TWT or MD values in the first column and corresponding values of your attribute in the column 2. Here is an example with values of CH4 in the well:
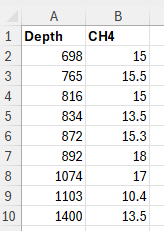
This can be done in Excel. Be sure that values of depth are sorted. Then you must save as a txt file (ASCII) with tab separators. Your file should be like File.txt
At this point you must close Excel. Otherwise you will have a sharing violation when you will try to import the file in Petrel.
In Petrel, right click on the well name and click on « Import (on selection) » and select « well logs (ASCII) »

In the window that opens, select MD (Measured Depth), MD in column 1.
In the Logs tab, click on « Specify logs to be loaded » and change the log name to CH4, change the column to 2, and select « Create new » in the Global well log » tab.

Once you click on OK, the well log is added to the well
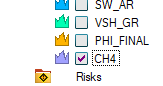
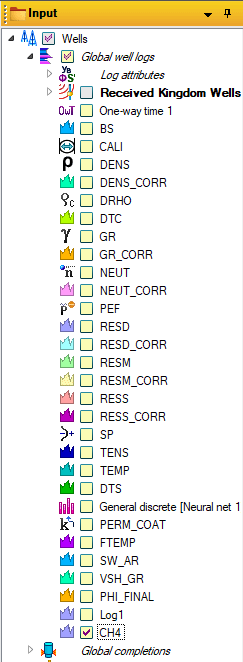
However, as you have selected create new log when importing, a new attribute has been added the « Global Well Log » attribute. In the left pane, just go to the top and expand Global Well Log, it should look like:
Double click on CH4 (the newly created attribute) and select style for the attribute.
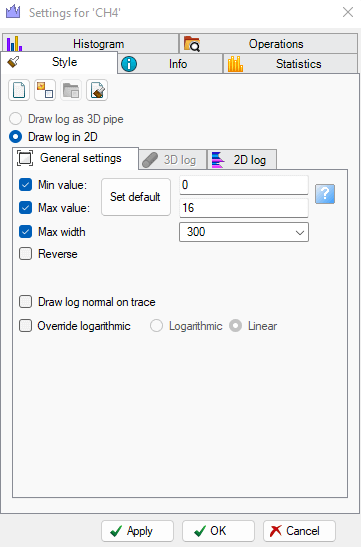
You can change the color bar, the style, fill the curve etc…
ENJOY !