Interpreting faults in seismic data leads to numerous mistakes (or misunderstanding).

The most important thing is:
In seismic softwares, a fault = one fault plane !
It has consequences on how to manage large collections of faults. It means that one fault plane = one file = one name. For instance, a en-relay fault could correspond to many fault segments = many fault planes = many files and names. At any time, try to answer this simple question: propagating faults, what for ?
If you want a nice image or cross-section, just export your profile and draw your interpretation in an illustrator-like software.
So, here is an example with Petrel:
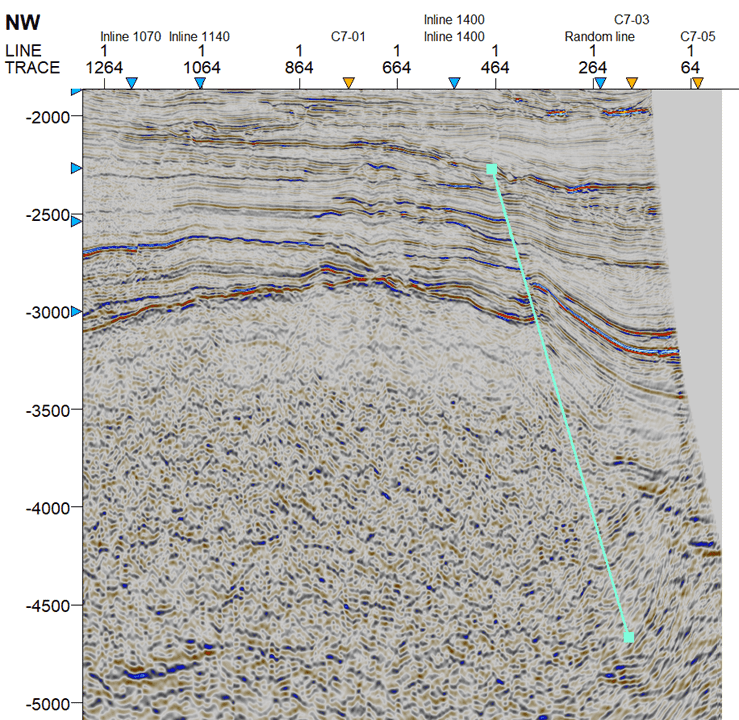
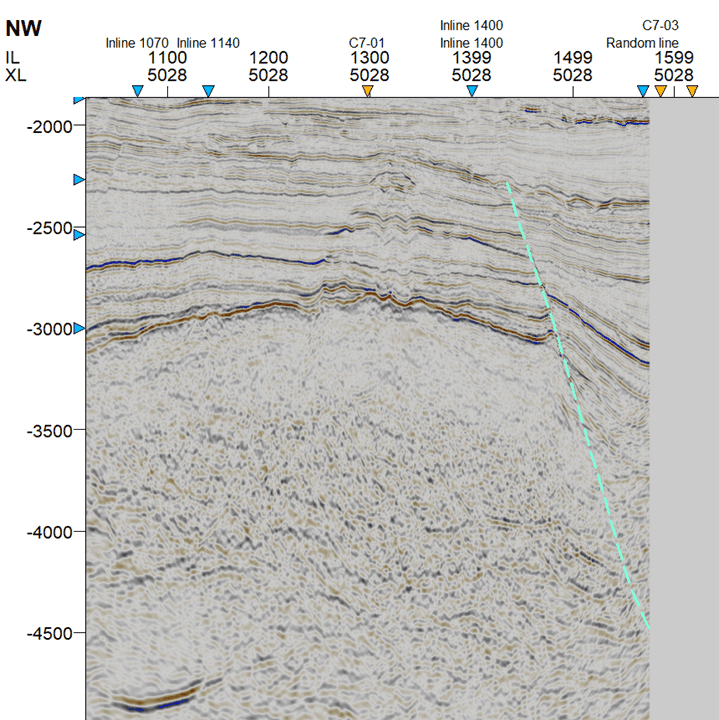
Open an interpretation window and select a seismic profile where a fault is visible.
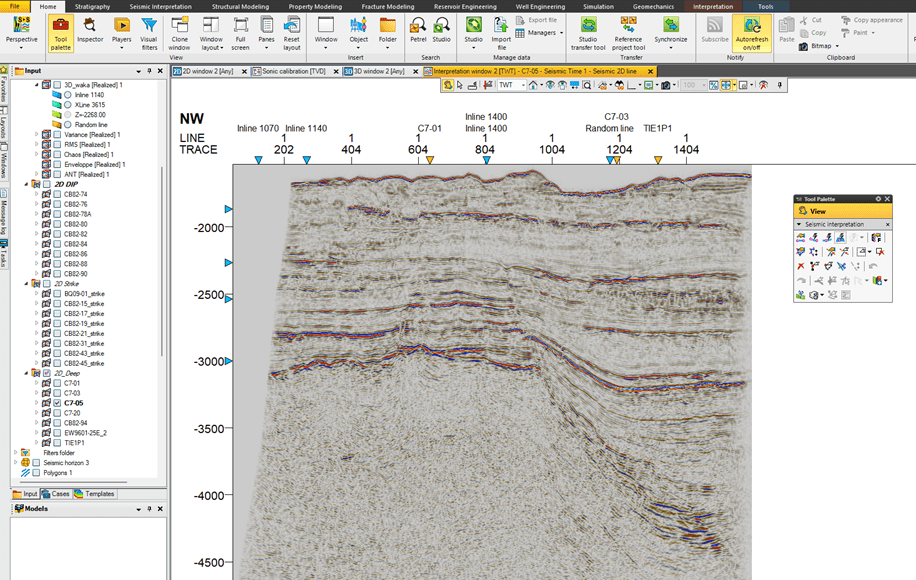
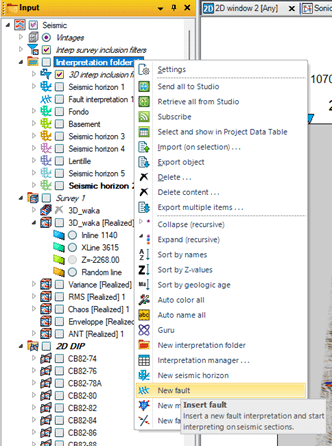
On this section, it would be interesting to map the large fault affecting basement. In the left pane, right click on « interpetation folder » and click on « new fault ».
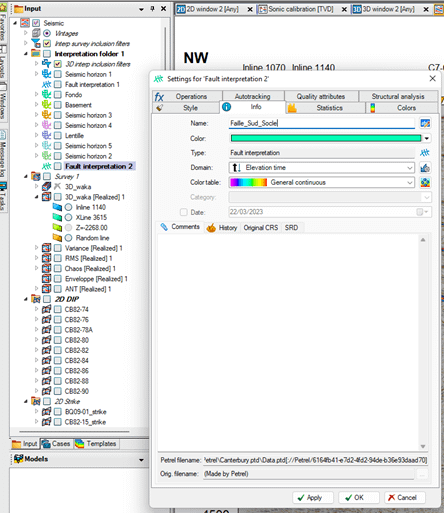
Right click on the newly created fault « fault interpretation x » and rename the file = rename the fault.
Click on « seismic interpretation » tab on top of the petrel window, and click on the « F » tool.
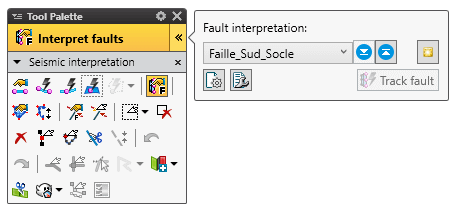
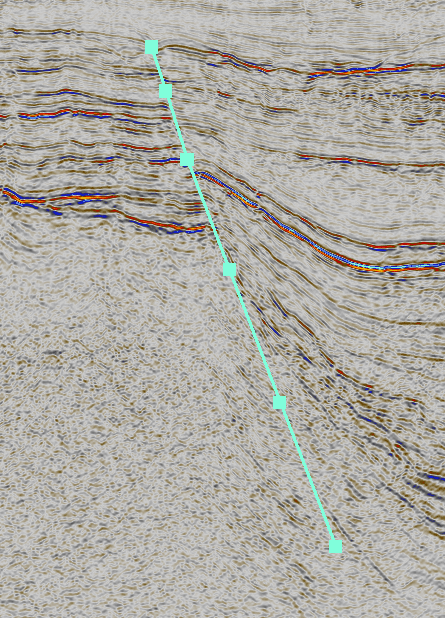
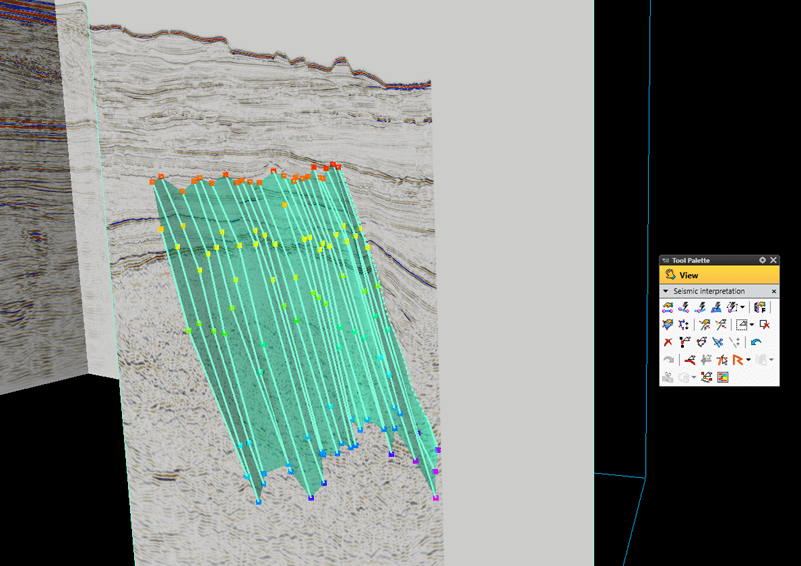
Be sure that the right fault plane is selected on the right, and start picking the fault plane. Double click once done.
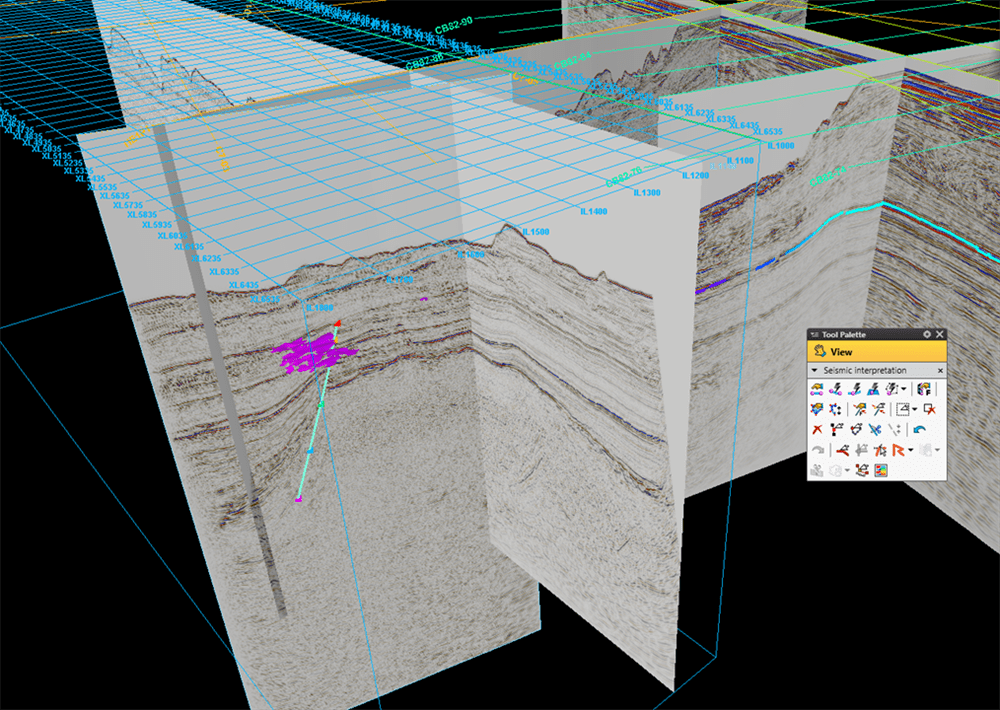
This fault can be displayed in a 3D window.
At this stage, it depends on your dataset. is it 2D or 3D data ?
in 2D, you can display another 2D profile. Be sure the fault plane is the same. You decide as an interpreter.
It means now you have 2 « segments » representing the fault plane
In 3D, it is a bit different as the next profile (Inline or Xline) is parallel and at a constant distance depending on the bin (i.e. 25m, 12,5 m or whatever). So, the software will display a dashed line representing the projection of the fault you’ve just picked. This is supposed to help you in picking the segment on this new profile. This is not a propagation !
You can scroll with the mouse to display forward or backward the next profile and pick the segments.
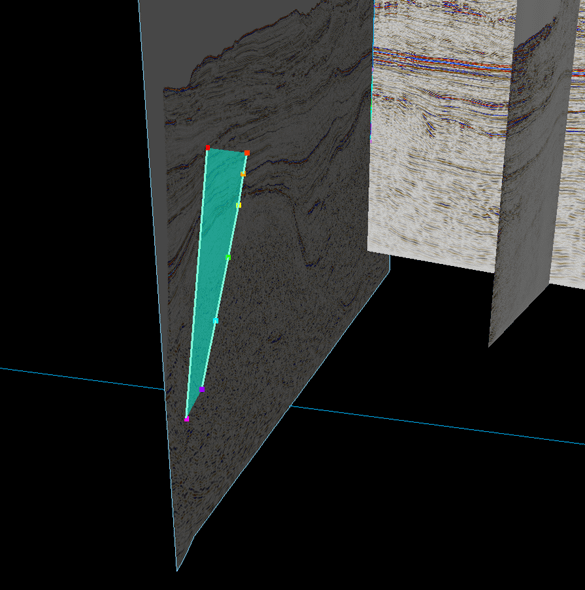
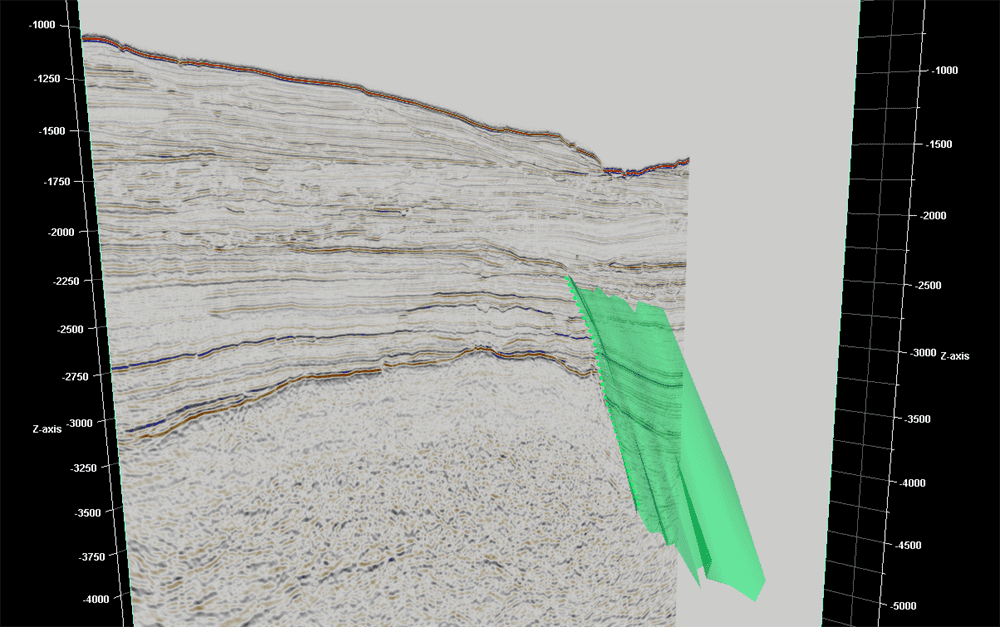
One done, you get a 3D fault plane.
This can be done either on an interpretion window or in a 3D window, depending on what you want: fast or precise ?
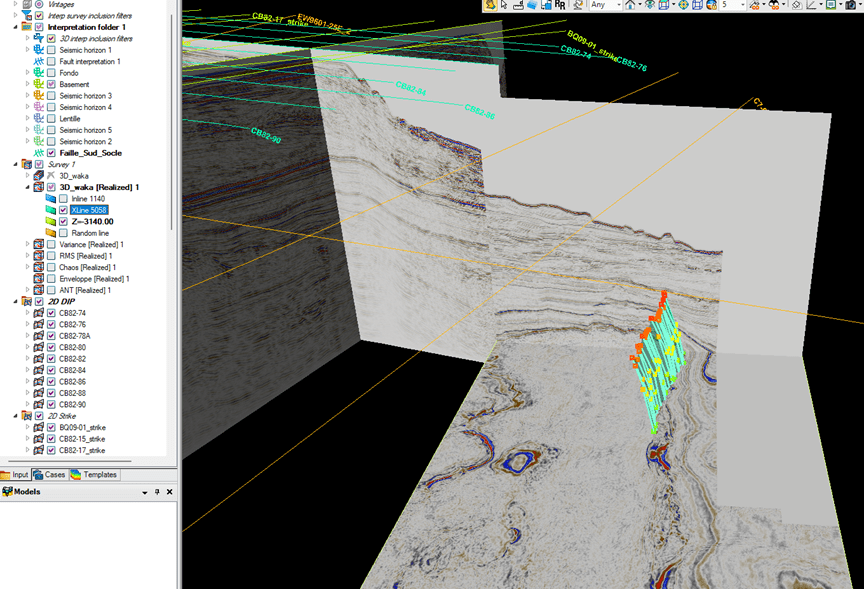
You can even pick the fault segment in plane view such as time slice or other « attribute slices ».
You can display only the fault plane and not the picking points. Right click on the fault name in the left pane and click settings. In points, uncheck the show tick. In lines, uncheck the show tick.
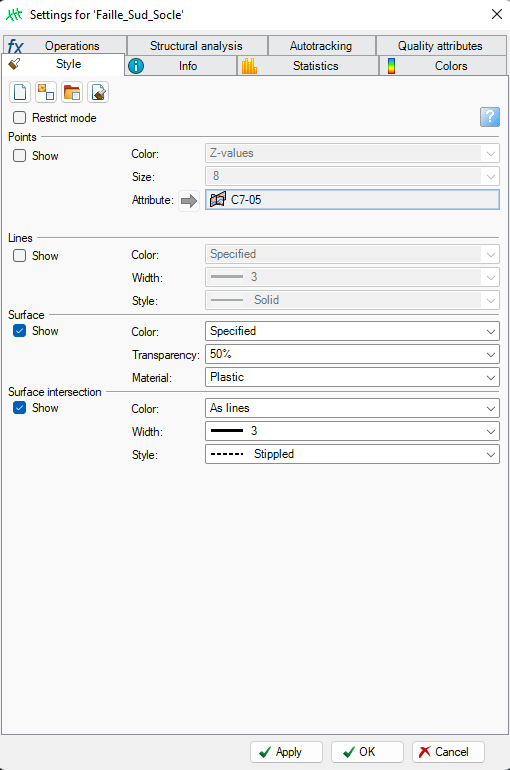
Now the fault is displayed with only the fault plane using shaded colors.
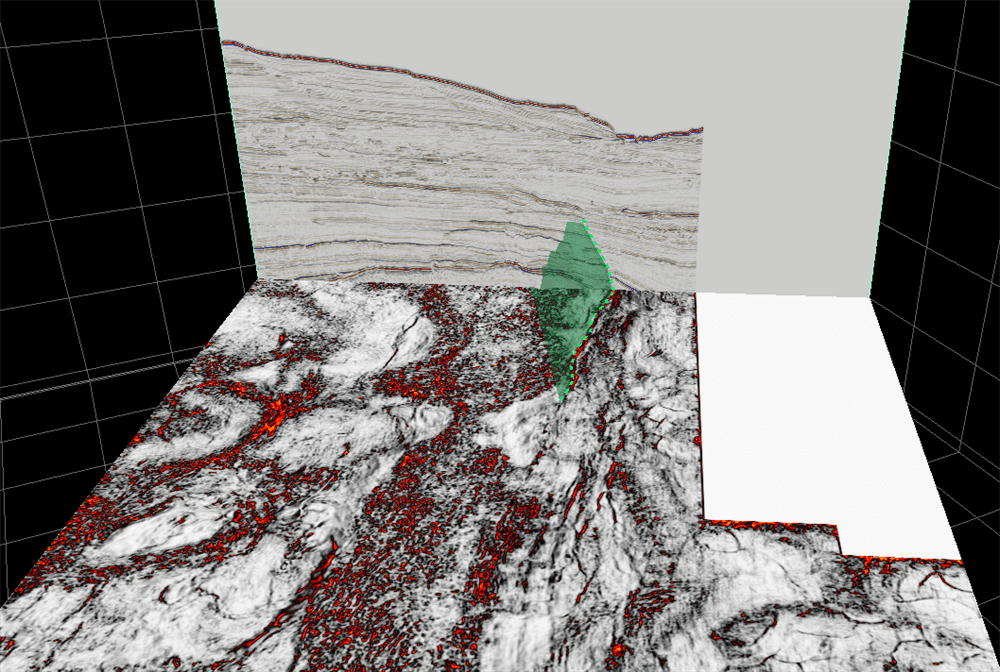
Some other attributes are dedicated to structural interpretation, such as the variance attribute. As shown in the image below, the fault plane is visible on the variance time slice and could be picked on a longer distance.
ENJOY !
Thank you so much for your contributions to geosciences. I am blessed to have met you, you are such a smart, intelligent, and humble Professor. This site is so helpful.
Thanks
JULIET.